Understanding statistics for data engineers: part 1
Although data engineers mainly deal with setting up the data flow and underlying infrastructure, there are often cases where statistics comes useful:
- 🕵️♂️ Detecting data quality issues
- 📊 Understanding distributions of data
- 🚨 Monitoring processes and triggering alerts
Mean (average): The most commonly used measure of average. sum(n)/count(n)
Median: Middle value of a sorted list. [0, 5 , (24), 50, 100]. Useful when dealing with outliers.
Mode: Most frequent value in a list. [0, 3, 3, 1000] -> 3
Relationship between mean and median under different skewness
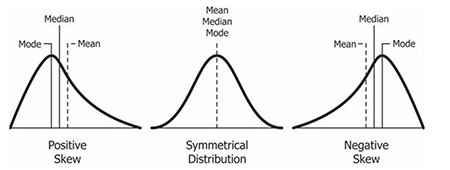
In a perfectly normal distribution, the mean, median, and mode are the same.
Histogram 📊 It’s good to be able to use a histogram to check the distribution of the data, detect outliers and see if the data is skewed which can help with sampling/ partitioning decisions.
Variance: Measure of how spread out a list of numbers is. Average of squared differences from mean. Not so easy to interpret—”On average, the squared difference from the mean is 2.67.”
Standard Deviation: Measure of how spread out a list of numbers is. Square root of variance. Easier to interpret—”The values on average are 1.63 units away from the mean.” Useful for monitoring systems where values deviating from the average might signal a problem.
Percentiles: The relative standing of a value within a dataset. For example, if you’re in the 90th percentile in a test, you scored higher than 90% of participants.
Quartiles: Like percentiles but simplified to 4 parts where values may stand:
- Q1 (25th percentile): 0% - 25%
- Q2 (50th percentile): 25% - 50%
- Q3 (75th percentile): 50% - 75%
- Q4 (100th percentile): 75% - 100%
Useful when specifying SLAs or when we need a simplified distribution summary.
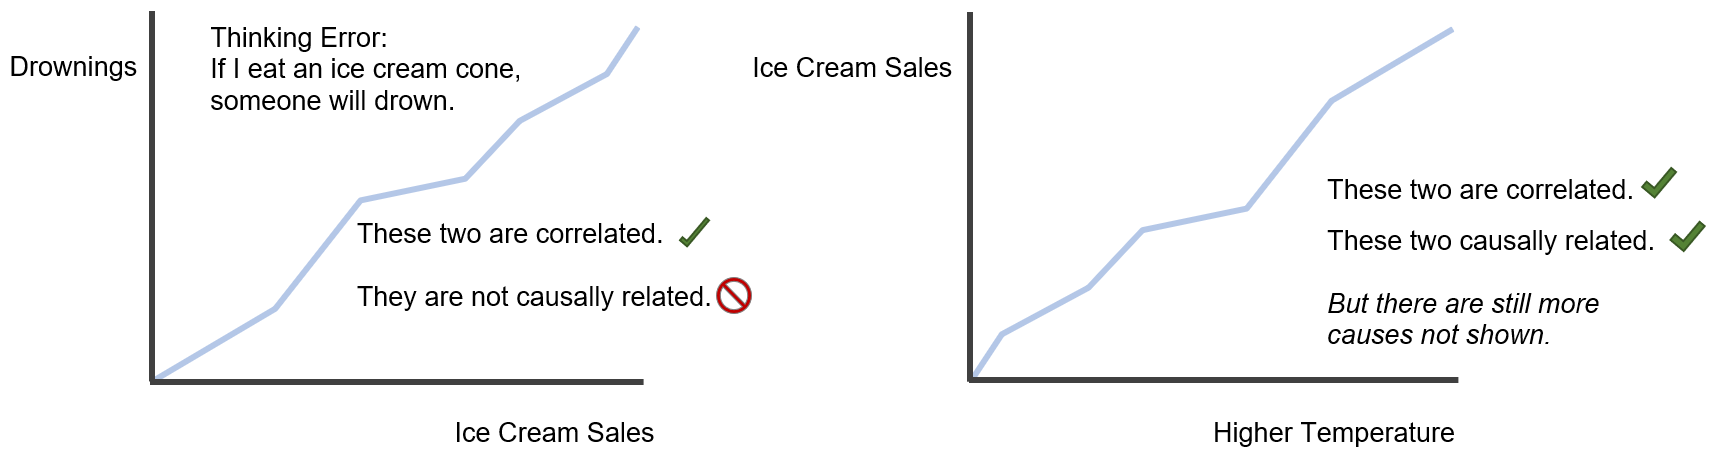
Correlation vs Causation 🔗🚫: Correlation measures the relationship between two variables. Causation takes place when one variable directly influences another. Correlation does not imply causation.
Example: Drowning deaths and ice cream sales are correlated. Every year, in the summer ice cream sales go up and so do drowning deaths. But this does not mean that ice cream sales cause drowning deaths.
Correlation vs Causation
In the next part I will go through:
- 🧪 A/B testing